How to Implement Winmo’s New OTT Insights
With entertainment limited to our houses and imaginations the last year-plus, most of us turned to streaming (and sourdough bread) to replace IRL experiences like concerts, theater, movies, and even travel. My friends and I spent the first three months of quarantine with a standing Tuesday night Teleparty date. As more Americans switch from traditional broadcasting platforms to online streaming services, so too must the brands looking to engage them. Luckily, Winmo OTT insights are here.
This shift is exactly why OTT (over the top, but you knew that already…) is here to stay. Millions of people stream Netflix, Hulu, HBO Max, Paramount+, you name it. And many don’t mind sitting through a few ads to access their content for free. In fact:
- Every area of home entertainment spending has declined over the past five years except online video.
- It’s expected that up to 27% of homes in the U.S. will have cut the cord by the end of 2021.
- 25% of adults added a new streaming service to their mix between June and August 2020.
- More people have at least one streaming video subscription (68%) which is more than those who have a traditional pay-TV subscription (65%).
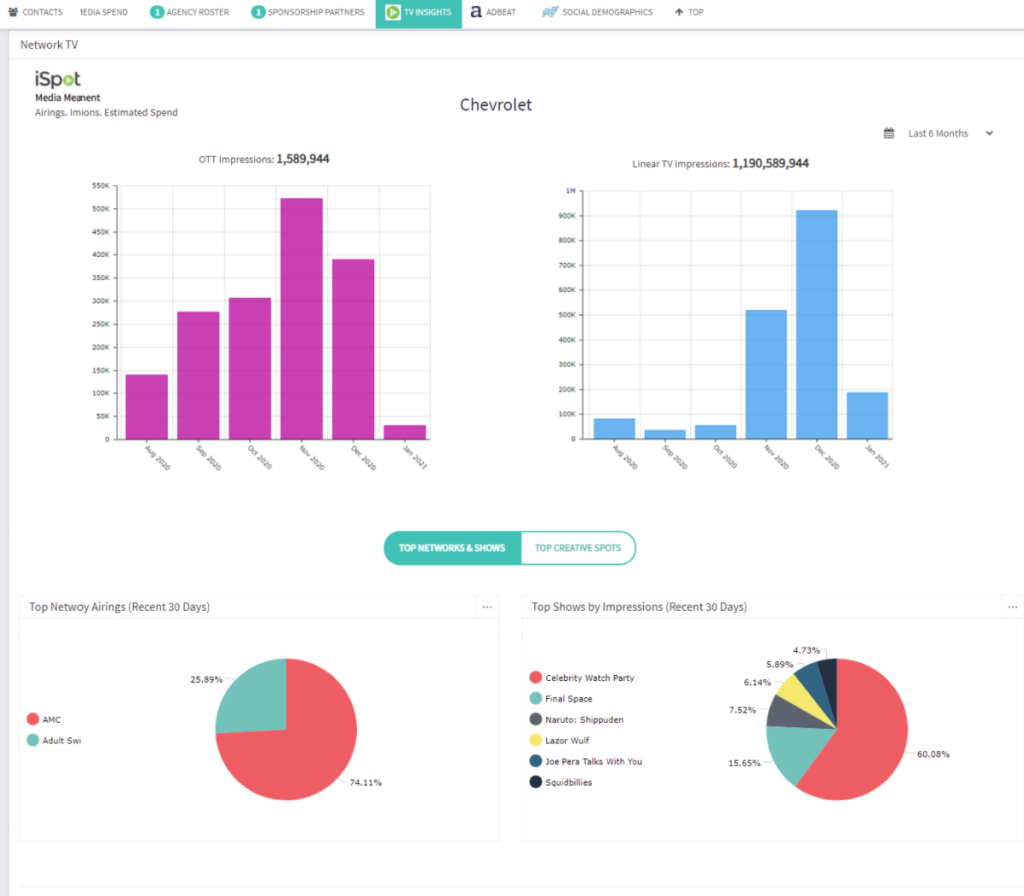
Winmo has incorporated OTT impression data from measurement leader iSpot to help users surface advertisers spending in streaming and connected TV.
We’re on the cutting edge of a media environment that’s growing at a rapid pace — allowing users to identify who is spending in OTT and their digital impressions. To see the opportunities our users can surface with OTT data, check out this list of 25 top non-linear TV spenders in the Food & Beverage category. The list includes key brand decision-makers and their media agencies per Winmo, so you can get a head start on reaching key OTT budget-holders.
Over the past five years (though many brands will argue 10), OTT has become the preferred platform for emerging, challenger brands and those targeting a younger demographic. So, even if you don’t offer OTT solutions, this filter identifies prospects hoping to elevate their category presence and raise their profile with Gen-Z and Zillennial consumers.
And which industries are we seeing leading the revolution as those emerging, challenger brands? Technology, retail, and media are the biggest spenders, including D2C, cellular providers, fitness software, social networks, and, music streaming (because hey, if you’re streaming a TV show, you’re probably streaming music, too).
Here’s how to implement Winmo’s new OTT insights for your own company:
- First, see which forward-thinking brands are spending on OTT (this includes two views: past 30 days and past 6 months).
- Then, dive into client-side and agency decision-makers responsible for those budgets.
- Utilize OTT impression data alongside linear to understand a prospect’s media mix and buying strategy.
- Media companies: See which brands are placing media here through Winmo’s OTT search filter. If your company qualifies prospects by OTT spend, utilize that filter alongside audience demographic, planning period, territory, and more. Then, generate a list of hyper-qualified prospects and export them to Excel or your CRM.
- Agencies: Leverage this intelligence to size up brands you’re pitching and assess whether they can offer OTT assistance.

Here’s a sneak peek into Winmo’s newest feature, OTT data from iSpot. (Source: Winmo)


